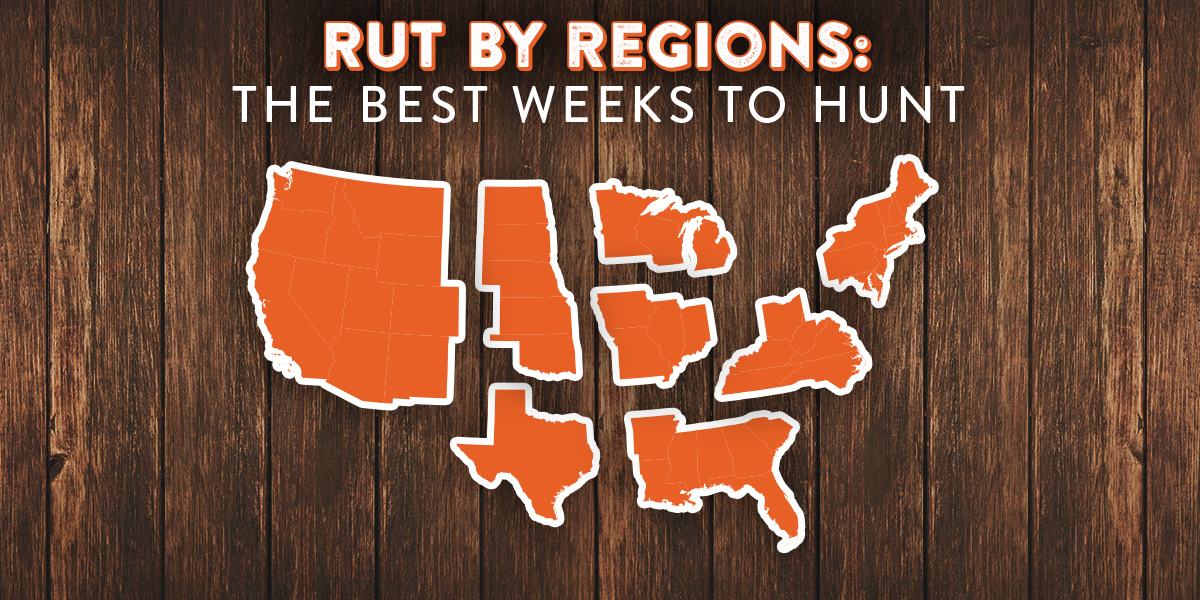
A rut activity prediction based on actual hunter data? Say it ain’t so! With plenty of Rut Predictions out there for every theory, we’re excited to share with you one that’s backed by actual hunter data in our first annual “Data Driven Regional Rut Predictions”. Legendary Whitetails has teamed up with the Quiver Hunting App to provide a groundbreaking analysis as to when you should really be hunting the rut in your area. Using data from 2015 that was logged in the App by hunters across the country, we can accurately display the peak activity levels for each region and state.
If you believe the rut occurs at the same time every year (just take a peek at the QDMA data), this data should be gold! It’s no surprise that November is “THE MONTH” around the country, but the weekly differences are intriguing. Check out the results below and download the Quiver Hunting App for free so you can hunt smarter and help contribute to the aggregate data pool for years to come.
What is Quiver?
The Quiver Hunting App was built for the whitetail hunting fanatic who wants to improve their chances in the deer woods. This hunting app allows you to track your hunts with a few taps of your finger – similar to a hunting journal, only much easier to do from the stand. The app also provides and logs hunting specific weather data that helps you make better decisions on when and where to hunt. Click here to learn more.
The Study
In order to provide an accurate display of peak regional activity, the Quiver team started to research the 2015 hunting logs. From there, we worked to find the peak deer activity levels from each state, which were determined by measuring the “average # of deer seen per hunt”. Since many of us hunters take an extended vacation to hunt the rut, we took it a bit further and determined the best overall 7-day period to hunt. In the end, we used weighted averages determined by the number of hunts logged in each state and placed states into specific regions to bolster the data sets since 2015 was the preliminary year for hunters to use the Quiver Hunting App.
*** RESULTS BY REGION ***
(It’s important to note that all of the data is reported in aggregate. No individual hunter data or locations are shared. The Quiver team does not share any individual hunting data.)

States: North Dakota, South Dakota, Nebraska, Kansas, Oklahoma
The Great Lakes
Peak Deer Activity: November 12 – November 18

States: Minnesota, Wisconsin, Michigan
The Heartland
Peak Deer Activity: November 9 – November 15

States: Iowa, Missouri, Illinois, Indiana
The East
Peak Deer Activity: November 10 – November 16

States: Ohio, Kentucky, Tennessee, West Virginia, Virginia, North Carolina
The Northeast
Peak Deer Activity: November 6 – November 12

States: Pennsylvania, New York, Vermont, New Hampshire, Maine, Massachusetts, Rhode Island, Connecticut, New Jersey, Delaware, Maryland
The Southeast
Peak Deer Activity: November 18 – November 24

States: Arkansas, Louisiana, Mississippi, Alabama, Georgia, South Carolina, Florida
The Lone Star State
Peak Deer Activity: November 21- November 27

States: Texas
We’re super excited to continue researching and analyzing trends produced by hunters with the help of the team over at Quiver. As more and more hunters use this mobile hunting log to track their hunts, the more interesting and powerful the insights on deer movement become. With 2015 being the inaugural year of Quiver, it will be interesting to compare these trends moving forward from year to year. Download the app for free today from iTunes and help to contribute data on future deer movement trends.


